
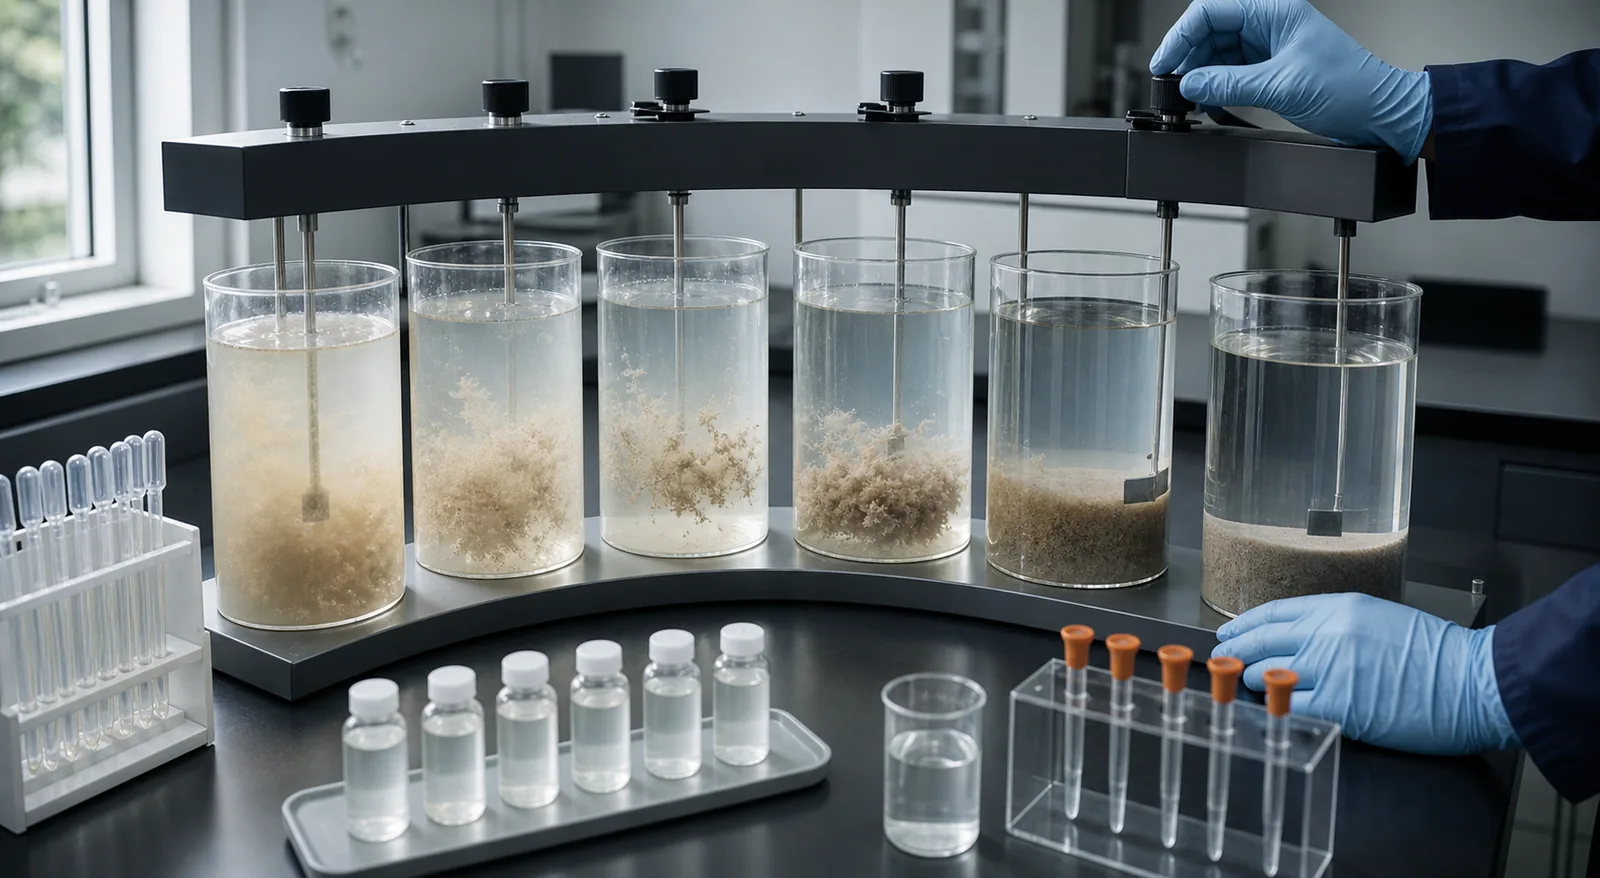
Preserve the feed before testing
Collect enough homogenized feed for the entire comparison and note sampling time, process state and solids concentration. Settling feed between jars creates an artificial dose trend. Mix the bulk sample gently before each split without changing its particle structure.
Use actual process water for polymer preparation or final dilution when dissolved ions are relevant. Keep temperature and delay from sampling consistent.
Normalize the polymer solution
Record neat product form and active basis, stock concentration, preparation water, induction method, mixing time and maturation. Calculate each addition on active polymer rather than treating equal solution volume as equal dose.
Prepare candidates at a concentration that can be delivered accurately. Use fresh, clean pipettes or syringes and avoid cross-contamination between ionic products.
Apply a repeatable mixing program
Distribute polymer quickly enough to contact the feed without immediately destroying forming floc. Follow with a defined low-shear period. If the plant includes a pump or restrictive feedwell, add a controlled shear stage to the laboratory sequence.
Record mixer geometry, speed and time. A jar result without contact history cannot be reproduced or transferred.
Measure a complete curve
Include a blank, underdose points, the apparent optimum and at least one overdose point. Measure at fixed times using endpoints tied to the equipment: supernatant turbidity, settling interface, compacted volume, capillary suction, drainage or filtrate solids.
Photographs support the record but do not replace numbers. The largest floc is not automatically the best operating point.
Scale on a stable process basis
Convert the selected active dose to dry solids, feed volume or another controlled plant basis. Confirm pump calibration, stock concentration and dilution water before comparing predicted and actual consumption.
Start the plant trial around the laboratory window, allow separator inventory to respond, and repeat during a difficult feed condition before procurement approval.
Use blanks and controls to detect bad tests
The untreated blank shows whether the feed settles or floats without polymer. The current plant product provides a performance control, while duplicate jars reveal splitting or mixing variation. If duplicates disagree substantially, repeat the test before ranking new candidates; a precise-looking curve built on inconsistent feed is not reliable.
Rinse vessels and mixers between ionic families and use separate dosing tools where contamination is possible. Record any unusual foam, oil layer, temperature change or rapid raw-feed settling.
Report the curve so another operator can repeat it
A useful report lists sample point and time, feed solids, chemistry, candidate code, active basis, stock preparation, active dose, mixer sequence and every endpoint with measurement time. Add photographs from the same angle and lighting only as supporting evidence. Include the blank and rejected overdose point, not just the preferred jar.
When plant response differs, this complete record allows preparation, contact, feed variability and equipment stress to be investigated separately instead of assuming the chemistry failed.